How can you organise performance indicators in the company?
Monitoring and Managing Production KPIs with Digital Visual Management
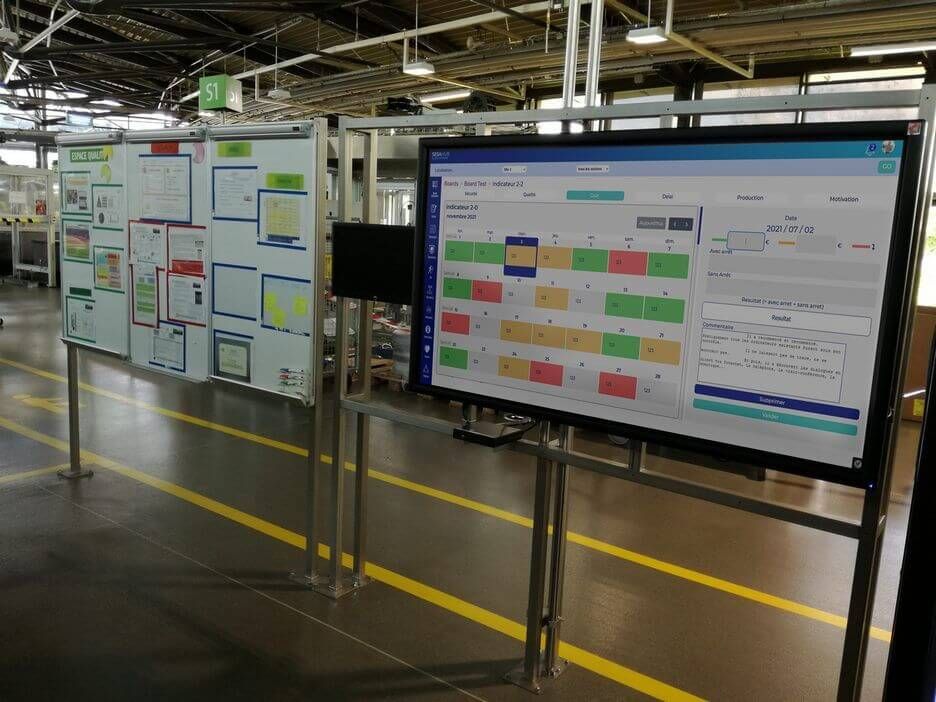
The use of Visual Management, also known as Shopfloor Management, is a fundamental pillar of Lean Manufacturing. It enables key performance indicators (KPIs) to be made visible, understandable, and actionable at every level of the organization.
Thanks to this approach, employees can visualize at a glance:
- production results
- deviations from targets
- issues that need to be addressed as a priority
The objective is simple: make fast and effective decisions based on clear and shared data.
Today, Digital Visual Management goes even further. It modernizes traditional practices by enabling more fluid, reliable, and real-time information management.
Why Digitalize Production KPI Monitoring?
The transition to digital tools is profoundly transforming industrial performance management.
With digital solutions such as SESAHUB, companies can:
- reduce unnecessary travel between production areas
- centralize performance data
- connect results to action plans
- reduce administrative tasks and manual processing
- move toward a paperless environment
- energize team meetings with interactive visual supports
Digitalization makes it possible to move from static management to dynamic, collaborative, and real-time management.
High-Performance Organization: A Key Competitive Advantage
All companies have access to similar resources: machines, infrastructure, and technical expertise.
However, what truly makes the difference is organization.
An effective organization is built on three pillars:
1. A Clear Strategy
Driven by leadership, it relies on Lean methodologies such as:
- 5S
- TPM
- continuous improvement (Kaizen)
2. Human Engagement
Performance depends directly on:
- team motivation
- employee skills
- involvement in achieving results
3. Effective Communication
Without communication, even the best teams cannot reach their full potential.
Visual Management plays a key role here by enabling:
- a shared understanding of objectives
- transparency of results
- responsiveness to deviations
Involving employees in KPI monitoring helps strengthen engagement and makes them active contributors to continuous improvement.
Structuring Data Collection at Every Level of the Organization
An industrial company is generally organized into several levels:
- workstations
- production cells
- departments
- management
Each level corresponds to a specific type of information and management horizon.
1. Workstation / Machine
This is the operational level.
Real-time or hourly data is collected here:
- quantities produced
- scrap
- incidents
- machine downtime
This information makes it possible to react immediately when deviations occur.
2. Production Cells
Production cells bring together several workstations.
They are used to monitor daily KPIs, particularly during short stand-up meetings (Top 5'):
- previous day's results
- current day's objectives
- ongoing issues
3. Departments
Departments group together multiple production cells.
They provide weekly monitoring through:
- trend analysis
- overall performance tracking
- action prioritization
4. Management / Company Level
At the strategic level, a monthly view is maintained:
- KPI summaries
- overall performance
- strategic decisions
The Challenge: Ensuring Reliable Information Flow
Effective performance management is based on a fundamental principle:
poor shop floor data leads to poor decisions
It is therefore essential to:
- collect reliable data
- consolidate it quickly
- make it accessible to everyone
This is precisely where digitalization brings significant value.
The Objectives of Visual KPI Management
A well-structured Visual Management strategy makes it possible to:
- quickly detect deviations
- correct issues as early as possible
- align all teams around the same objectives
- structure management routines (Top 5 meetings, weekly and monthly reviews)
- drive continuous improvement
As a result, every level of the organization benefits from a clear and relevant view of performance.
Managing SQCDP Indicators
In manufacturing, performance management is often based on SQCDP indicators:
- S – Safety: accidents, incidents, working conditions
- Q – Quality: defect rates, non-conformities
- C – Cost: productivity, production costs
- D – Delivery: on-time delivery, service levels
- P – People: absenteeism, skills, engagement
These indicators provide a comprehensive and balanced view of industrial performance.
Digitalizing KPI Monitoring with SESAHUB
To fully leverage the potential of Visual Management, it is essential to rely on a powerful digital solution.
SESAHUB is a platform dedicated to industrial performance management within an Industry 5.0 framework.
It enables companies to:
- centralize all production data
- visualize KPIs in real time
- monitor SQCDP performance indicators
- connect KPIs to action plans
- share information across all levels of the organization
Real-Time Management for Greater Responsiveness
With SESAHUB, data is collected directly from the shop floor and made available instantly.
Teams can therefore:
- immediately identify deviations
- make rapid decisions
- monitor performance trends
- prioritize actions
This responsiveness is essential to improve performance and prevent issues from accumulating.
A Tool Supporting Visual Management and Lean Manufacturing
SESAHUB integrates seamlessly into a Lean approach by strengthening:
- visual management
- communication between teams
- standardization of practices
- monitoring of improvement actions
Thanks to its intuitive and customizable interfaces, each user can access the information they need, at the right time.
Toward a Data-Driven Industry
With KPI digitalization, industrial management is evolving toward a more efficient model:
- more connected: all data is centralized
- more collaborative: teams share a common vision
- more responsive: decisions are made in real time
- more reliable: data is automated and secure
SESAHUB transforms industrial data into a true performance driver.